 Home
HomeHamburger sand test
Description
This text describes how to calibrate a the DEM model of a dry non-cohesive sand using inclination, static angle of repose and shear cell tests; see Figure 1.
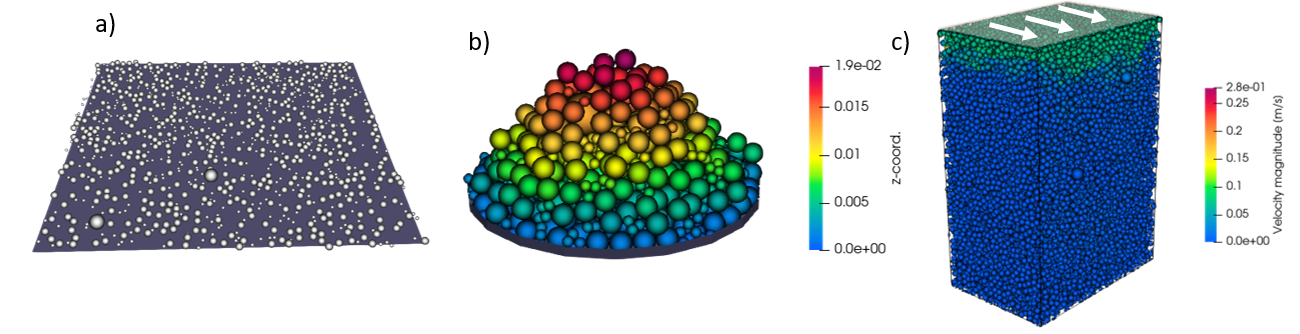
Figure 1: Simulation result of a) inclination test, b) static angle of repose and
c) shear cell obtained from the hamburgerSand tutorial.
Introduction
The flowability of a dry non-cohesive powder is mainly determined by the static and rolling friction between the individual particles and between particles and walls. In this tutorial, the particle-wall (p-w) rolling friction, the particle-particle (p-p) rolling friction and the p-p static friction coefficients are calibrated, respectively, using an inclination test, a static angle of repose and a shear cell test. The calibration is performed using a sequential approach, as specified by the run sequential at the bottom of the input script. This means that the p-w rolling friction, p-p rolling friction and the particle-particle static friction coefficients are calibrated one after the other.
Note
In the sequential approach, coefficients that have been already calibrated are used as fixed material properties in the following calibration steps.
The coefficient triplet returning the best agreement between reference and simulated data represents the solution of the calibration.
Detailed descriptions
Contact model and coarsegraining factor
The contact model and the coarsegraining factor are defined
in the file settings/contact_model.txt.
The models used in this tutorial are:
Hertz normal, tangential history,
rolling friction epsd2. The
cohesion model is switched off and the surface model is set to
default. More information
about the contact models allowed by the templates
can be found in the respective documentations.
The calibration simulations are performed with a coarsegraining
factor 2.
Material properties and particle size distribution
The values of the fixed material parameters and the initial, minimum and
maximum values of the target material parameters are defined in
the file settings/materials.txt.
Warning
Not all the parameters specified in materials.txt are used
by the simulations, as it depends on the contact models selected
in contact_model.txt
The particle size distribution is defined in the file
settings/particle_sizes.txt.
Calibration case settings
The tutorial consists of three calibration_cases of the template inclinedWall, static angle of repose and shear cell test.
Some template-specific settings of the calibration case are defined in the file settings/tests.txt.
Other more general settings, like the number of iterations of the calibration procedure,
can be found in the file settings/general.txt.
Running the tutorial and analyzing the results
The user can run the tutorial via command line as follows:
aspherix-calibration run -in hamburger_sand.casx
The results of the three sequential calibration steps
are collected in the folders calibration_c_rollFrict_pw,
calibration_c_rollFrict_pp and calibration_c_staticFrict_pp.
Inclination test result
The convergence of the calibration is reported in the file
calibration_c_rollFrict_pw/results/conv.dat, which reads as follows:
# nIter     c_rollFrict_pw qf_total
      1        0.505       0.505
      9     0.468333    0.468333
     15     0.456111    0.456111
     28     0.431667    0.431667
     35     0.419444    0.419444
The iteration returning the lowest value of the quality function is the number 35. Since the quality function of the inclination test template is defined as the sum between the actual value of the p-w rolling friction coefficient and a term proportional to the total particle kinetic energy, the minimum of the quality function corresponds to the lowest value of the p-w rolling friction coefficient allowing a plate inclination equal to the target angle without triggering any particle movement.
Static repose angle result
The convergence of the calibration is reported in the file
calibration_c_rollFrict_pp/results/conv.dat, which reads as follows:
# nIter   c_rollFrict_pp     qf_total
  1            0.255         0.199193
  2         0.418333         0.148621
  4         0.472778         0.122702
  8         0.490926         0.121391
  9          0.45463         0.109769
 18         0.442531         0.106373
 23         0.484877        0.0887126
The iteration returning the lowest value of the quality function is the number 23. The comparison between the reference and the simulated heap’s shape is shown in Figure 2.
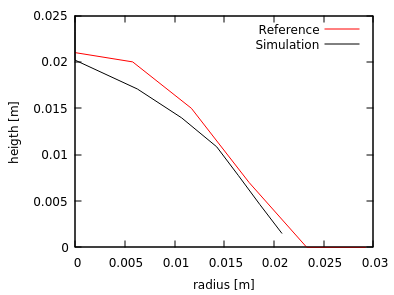
Figure 2: height of the particle’s heap as a function of the radius (reference and simulation 23).
Shear cell test result
The convergence of the calibration is reported in the file
calibration_c_frict_pp/results/conv.dat, which reads as follows:
# nIter       c_frict_pp      qf_total
  1           0.7505          266.503
  9         0.694981          121.226
The iteration returning the lowest value of the quality function is the number 9. The comparison between the reference and the simulated yield locus is shown in Figure 3.
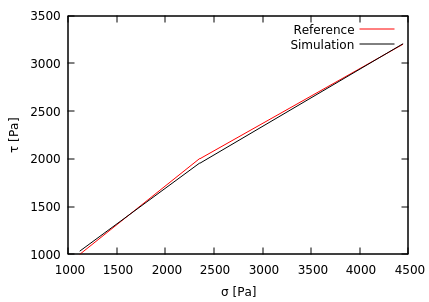
Figure 3: yield locus (reference and simulation 9).
In summary, the result of the calibration consists of the following parameter triplet:
c_rollFrict_pw = 0.419444
c_rollFrict_pp = 0.484877
c_frict_pp = 0.694981