 Home
HomeCohesive powder calibration
Description
This text describes how to calibrate a the DEM model of a cohesive powder using shear cell tests.
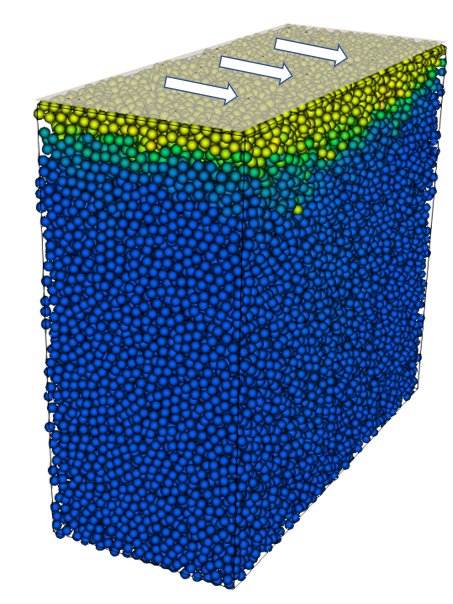
Figure 1: Simulation result of shear cell obtained from the
cohesivePowderCalibration tutorial.
Introduction
The flowability of a cohesive powder depends essentially on the friction and cohesive forces acting between the individual particles and between the particles and the walls. In this tutorial, the particle-particle (p-p) static and rolling friction coefficients, and the p-p cohesion coefficients are calibrated using different instances of the shear cell test.
The calibration is performed in two steps, corresponding to two distinct
input scripts: cohesive_powder_first.casx and cohesive_powder_second.casx.
In the first step, the p-p static and rolling friction coefficients are
calibrated together using a reference dataset at a high pre-shearing normal
stress. At this stage, the cohesion model coefficients are kept fixed and equal to
an estimated value, as the effect at high pre-shearing stresses of the
cohesion forces should be negligible in comparison to the friction forces.
In this tutorial we avoid calibrating the particle-wall static and friction
coefficients. This is a reasonable assumption in this case, as the experimental
dataset has been obtained from a torsion shear cell and not a ring shear
cell test (the effect of the walls on the latter is far bigger than on the first).
In the second step, the p-p cohesion strenght and p-p maximum cohesion stress of the cohesion adaptive model are calibrated using, respectively, a reference dataset at a medium and low pre-shearing normal stress. At this stage, the p-p static and rolling friction coefficients obtained in the first step are kept fixed and equal to the calibrated values obtained in step 1. The calibration is performed using a single multi-dimensional approach (in contrast to a sequential approach), as specified by the run single at the bottom of the input script. The quality functions returned by the calibration cases are summed together and the value of this sum measures the overall agreement between reference and simulation data. The coefficient couple (p-p cohesion strenght and maximum cohesion stress) returning the best agreement between reference and simulated data represents the solution of the calibration.
Detailed descriptions
Contact model and coarsegraining factor
The contact model and the coarsegraining factor are defined
in the file settings/contact_model.txt.
The models used in this tutorial are:
Hertz normal, tangential history,
rolling friction epsd2. The
cohesion model is set to adaptive
and the surface model is set to default.
More information about the contact models allowed by the templates
can be found in the shear cell test
documentation. The calibration simulations are performed without
coarsegraining (i.e., coarsegraining factor = 1).
Material properties and particle size distribution
The values of the fixed material parameters and the initial, minimum and
maximum values of the target material parameters are defined in
the file settings/materials.txt.
The parameter ranges of p-p cohesion strength is normally from 0.05 to 0.7 for cohesive powders, while the p-p maximum cohesive stress is between 0.0 and the pre-shearing normal stress.
Warning
Not all the parameters specified in materials.txt are used
by the simulations, as it depends on the contact models selected
in contact_model.txt
The particle size distribution is defined in the file
settings/particle_sizes.txt.
Calibration case settings
The tutorial consists of three calibration_cases of the
template shear cell test:
one located in cohesive_powder_first.casx and two in
cohesive_powder_second.casx.
Some template-specific settings of the calibration case are defined in the file settings/tests.txt.
Other more general settings, like the number of iterations of the calibration procedure,
can be found in the file settings/general.txt.
Running the tutorial and analyzing the results
The user needs first to run the first calibration step using the following command:
aspherix-calibration run -in cohesive_powder_first.casx
In this case, the only calibration case in cohesive_powder_first.casx
is run by default using 4 cores. In order to set a user-defined number
of cores, e.g., 8, the following command is required:
aspherix-calibration run -in cohesive_powder_first.casx -np 8
At the end of the first step, the user needs to copy the values
of the calibrated p-p static and rolling friction coefficients
and update the corresponding variable in the settings/materials.txt
file:
variable fric_coef_pp string [calibrated value p-p static friction]
variable roll_coef_pp string [calibrated value p-p rolling friction]
After that, the user can run the second calibration step using the following command:
aspherix-calibration run -in cohesive_powder_second.casx
or, for simulating the two calibration cases in parallel each one with 2 cores, with the following command:
aspherix-calibration run -in cohesive_powder_second.casx -ncases 2 -np 2
At the end of the second step, the user reaches the solution of the tutorial, consisting in 4 calibrated parameters: the static and rolling friction coefficients obtained from step 1, the p-p cohesion strenght and p-p maximum cohesion stress obtained from step 2.
Result of first calibration step
At the end of the first step, the user can check the convergence of the calibration
by opening the file calibration/results/conv.dat, which reads as follows:
# nIter       c_frict_pp   c_rollFrict_pp         qf_total
      1              0.5              0.5          6941.47
      2         0.766667              0.5          3317.35
      5              0.5         0.233333          1363.58
     10         0.588889         0.233333          1343.22
     18         0.618519         0.233333          906.075
     22         0.855556              0.5           723.23
     29         0.855556         0.411111          426.513
The iteration returning the lowest value of the quality function is the number 29. The comparison between the reference and the simulated yield locus is shown in Figure 2.
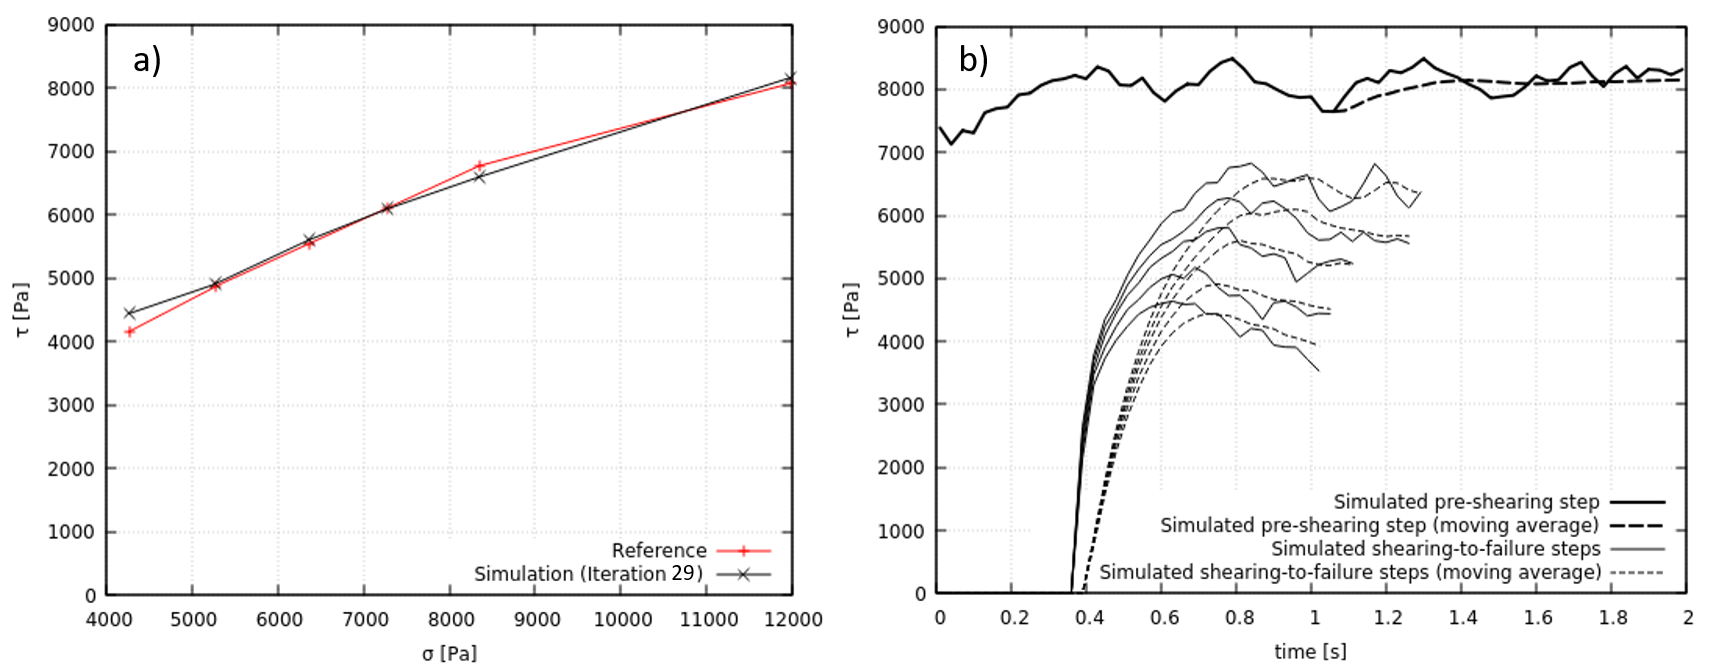
Figure 2: a) pre-shearing point and yield locus (reference and simulation), b) tangential shear stresses
at pre-shearing and shearing-to-failure obtained from the simulation. The maxima of the average
shearing-to-failure curves corresponds to the shearing points of the yield locus in a). The curves in a)
can be plotted using the output files simulation_results.txt and reference.txt in the folder
calibration/workDir/workDir.29/Aspherix/test1. The curves in b) can be plotted using the output files in
calibration/workDir/workDir.29/Aspherix/test1/data; in particular, stressesDown_pre_stress_11989.4445.dat
for the pre-shearing curve and stressesDown_stress_*_pre_11989.4445.dat for the shearing-to-failure curves.
The values of static and rolling friction coefficients
in the file settings/materials.txt need to be updated
with the calibrated values before proceeding with the
second step.
variable fric_coef_pp string 0.855556            # particle/particle coefficient of friction []
variable roll_coef_pp string 0.411111            # particle/particle coefficient of rolling friction []
Result of second calibration step
At the end of the second step, the user can check the convergence of the calibration
by opening the file calibration/results/conv.dat, which reads as follows:
# nIter   cohStrength_pp   maxCohStress_exp_pp         qf_total         qf_test2         qf_test3
      1            0.375                   2.5           3565.1          2923.84          641.262
      2            0.625                   2.5          3368.87          2727.57          641.298
      3            0.125                   2.5          3317.31          2559.16          758.148
      4            0.375                   3.5          1310.75          1148.49          162.266
     12            0.375               3.83333          1007.55          687.513          320.042
     15         0.291667               3.83333          724.051          523.315          200.736
     27         0.282407               3.83333          670.665          342.951          327.713
     32         0.282407               3.87037          479.277           401.81           77.467
The iteration returning the lowest value of the quality function is the number 32. The comparison between the reference and the simulated yield loci are shown in Figure 3.
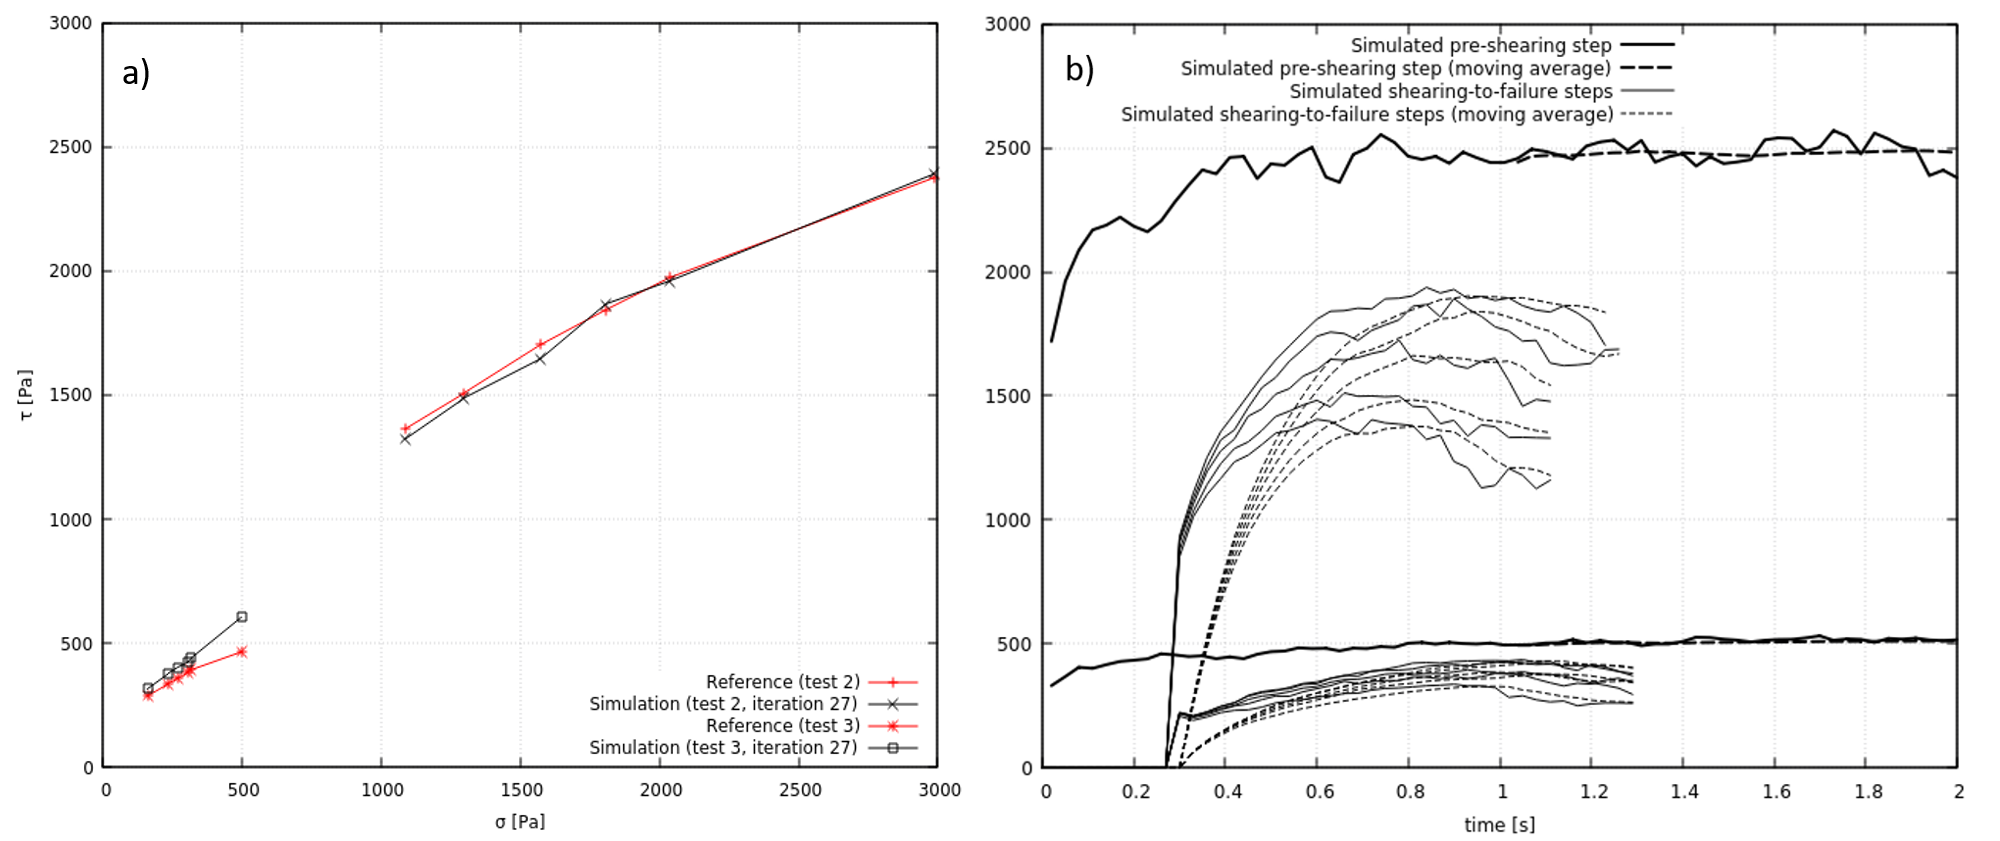
Figure 3: a) pre-shearing point and yield locus (reference and simulation), b) tangential shear stresses
at pre-shearing and shearing-to-failure obtained from the simulation. The maxima of the average
shearing-to-failure curves corresponds to the shearing points of the yield locus in a). The curves in a)
can be plotted using the output files simulation_results.txt and reference.txt in the folder
calibration/workDir/workDir.32/Aspherix/test2 and calibration/workDir/workDir.32/Aspherix/test3.
The curves in b) can be plotted using the output files in calibration/workDir/workDir.32/Aspherix/test2/data
and calibration/workDir/workDir.32/Aspherix/test3/data.
In summary, the result of the calibration consists of the following 4 parameters:
c_frict_pp = 0.855556
c_rollFrict_pp = 0.411111
cohStrength_pp = 0.282407
maxCohStress_exp_pp = 3.87037