 Home
HomeCalendaring calibration
Description
This text describes how to calibrate a the DEM model of a paste for the production of electrodes in lithium-ion batteries.
Introduction
This tutorial shows an application of the calibration template
electrodeCalendaring. A
laterally-unbounded layer of paste undergoes a cycle of compression and
relaxation between a fixed plate (the electrode) and a plate moving vertically,
which simulates the movement of a cilindrical roller moving over the layer. The
mechanical properties of the paste, which is modelled as bounded spherical
particles, affect the: a) final thickness of the layer after the relaxation
phase, b) the maximum normal stress reached during compression. The scope of
this tutorial is to calibrate the Thornton-Ning normal contact model and the bond cohesion model so that the final layer thickness
and the maximum normal stress matches the reference data reported in the file
measurements/test.txt.
Detailed descriptions
Contact model
The contact model and the coarsegraining factor are defined in the file
settings/contact_model.txt. The models used in this tutorial are:
Thornton-Ning normal contact and
bond cohesion model. The tangential model and
the rolling friction model are switched off. The option create_bond_always
off ensures that bonds are created only once at the beginning of the
simulation and not dynamically during the calendaring process; please, refer to
the template documentation for
more information.
Material properties and particle size distribution
The values of the fixed material parameters and the initial, minimum and
maximum values of the target material parameters are defined in
the file settings/materials.txt.
Warning
Not all the parameters specified in materials.txt are used
by the simulations, as it depends on the contact models selected
in contact_model.txt
The particle size distribution is defined in the file
settings/particle_sizes.txt.
Calibration case settings
The tutorial consists of a single calibration_case of the
template electrodeCalendaring.
Some template-specific settings of the calibration case are defined in the file
settings/tests.txt.
Other more general settings, like the number of iterations of the calibration procedure,
can be found in the file settings/general.txt.
Running the tutorial and analyzing the results
The user can run the tutorial via command line as follows:
aspherix-calibration run -in calendaring_calibration.casx
The convergence of the calibration is reported in the file
calibration/results/conv.dat, which reads as follows:
# nIter cy_pwd eps_n_pwd eps_nt_pwd eps_t_pwd eps_tt_pwd kn_pwd kt_pwd qf
  1       0.0505          15          15          15          15       30000       30000     1.32965
  3       0.0175          15          15          15          15       30000       30000    0.129348
 17       0.0175     11.6667          15          15          15       30000       30000    0.126172
 21       0.0175          15          15     11.6667          15       30000       30000    0.117318
 26       0.0175          15          15          15          15       30000     43333.3   0.0956804
 29       0.0175     11.6667          15          15          15       30000     43333.3    0.081523
 33       0.0175          15          15     11.6667          15       30000     43333.3   0.0774631
 38       0.0175     18.3333          15     11.6667          15       30000     43333.3   0.0768049
 39       0.0175     11.6667          15     11.6667          15       30000     43333.3   0.0738781
 40       0.0175          15     18.3333     11.6667          15       30000     43333.3   0.0708861
 41       0.0175          15     11.6667     11.6667          15       30000     43333.3   0.0687808
 47       0.0175     11.6667     11.6667     11.6667          15       30000     43333.3   0.0606057
 53       0.0175     11.6667     11.6667     11.6667     11.6667       30000     43333.3   0.0544448
 62       0.0175     12.7778     11.6667     11.6667     11.6667       30000     43333.3   0.0540077
The iteration returning the lowest value of the quality
function is the number 62. The normal stress exerted by
the roller onto the layer ( ), the porosity
and thickness (
), the porosity
and thickness ( ) of the layer are plotted
as a function of time in Figure 1.
) of the layer are plotted
as a function of time in Figure 1.
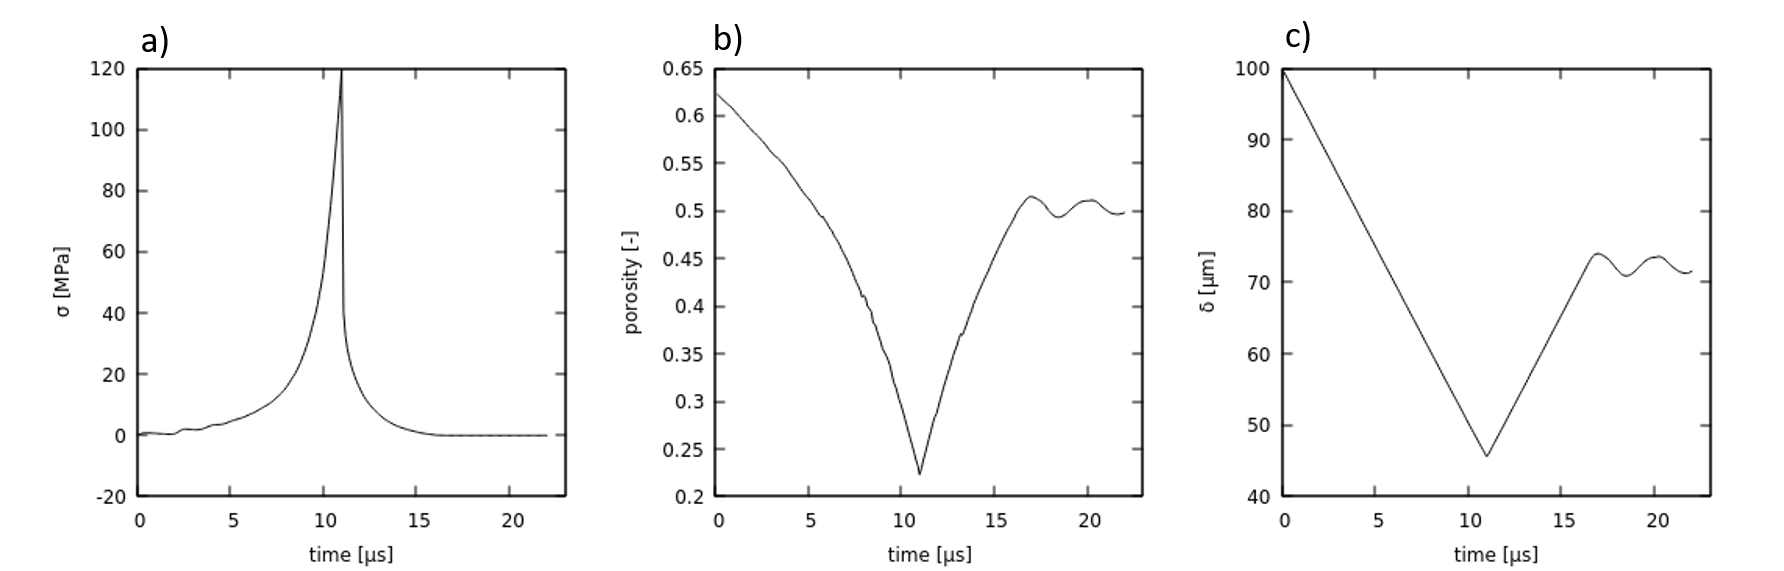
Figure 1: a) normal stress, b) porosity and c) thickness of the
layer as a function of time obtained at iteration 62. Notice that
the peak of the normal stress and the final value of the layer
thickness correspond with good approximation to the reference values
in measurements/test.txt. The curves can be plotted using the output
file output.txt in calibration/workDir/workDir.62/Aspherix/test1/post.