 Home
HomeFluidized bed test
Description
This text describes how to calibrate the fluid-particle drag model using a bulk density, a volume fraction and a fluidized bed test; see Figure 1.
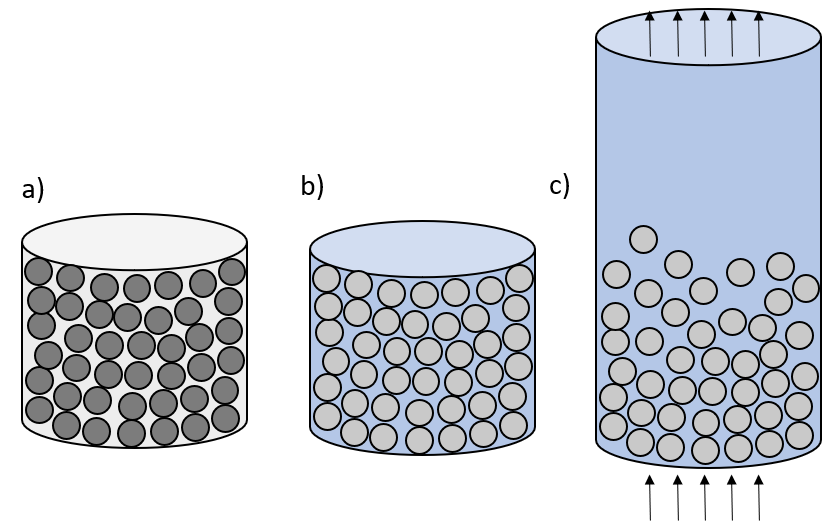
Figure 1: Sketch showing a) bulk density test, b) volume fraction test and c) fluidized bed test.
Introduction
Particle fluidization depends on the bulk density of the packed bed, volume fraction of the system (i.e., ratio between particle volume and container volume) and drag coefficients between particle and fluid. The calibration workflow presented here consists of three steps: 1) calibration of the particle density, 2) calibration of the scaling coefficient for the particle volume and 3) calibration of the scaling coefficient for the drag force. These steps correpond to the calibration templates bulk density test, volume fraction test and Ergun test respectively.
The calibration is performed using a sequential approach,
as specified by the run sequential at the bottom
of the input script. This means that the particle density, the scaling
factor for the particle volume (see volScal in the CFDEM®coupling
documentation) and the scaling for the drag force (see scaleDrag
in the CFDEM®coupling documentation) are calibrated one after the other.
Note
In the sequential approach, coefficients that have been already calibrated are used as fixed material properties in the following calibration steps.
The coefficient triplet returning the best agreement between reference and simulated data represents the solution of the calibration.
Detailed descriptions
Contact model and coarsegraining factor
The contact model and the coarsegraining factor are defined
in the file settings/contact_model.txt.
The models used in this tutorial are:
Hertz normal, tangential history,
rolling friction epsd2. The
cohesion model is switched off and the surface model is set to
default. More information
about the contact models allowed by the templates
can be found in the respective documentations.
The calibration simulations are performed with a coarsegraining
factor 2.
Material properties and particle size distribution
The values of the fixed material parameters and the initial, minimum and
maximum values of the target material parameters are defined in
the file settings/materials.txt.
Warning
Not all the parameters specified in materials.txt are used
by the simulations, as it depends on the contact models selected
in contact_model.txt
The particle size distribution is defined in the file
settings/particle_sizes.txt.
Calibration case settings
The tutorial consists of three calibration_cases of the template bulk density test, volume fraction test and Ergun test.
Some template-specific settings of the calibration case are defined in
the file settings/tests.txt. Other more general settings, like the
number of iterations of the calibration procedure, can be found in the
file settings/general.txt.
Running the tutorial and analyzing the results
The user can run the tutorial via command line as follows:
aspherix-calibration run -in ergun_test.casx
The results of the three sequential calibration steps
are collected in the folders calibration_rho_p,
calibration_CFD_volFracScale and calibration_CFD_scaleDrag.
Bulk density test result
The convergence of the calibration is reported in the file
calibration_rho_p/results/conv.dat, which reads as follows:
# nIter      rho_p         qf_total
  1          1100          0.288655
  3          833.333       0.0237463
  8          862.963       0.0109649
 15          853.086       0.000605465
The iteration returning the lowest value of the quality function is the number 15, where the quality function measures the discrepancy, in absolute value, between the reference and the simulated bulk density.
Volume fraction test result
The convergence of the calibration is reported in the file
calibration_CFD_volFracScale/results/conv.dat, which reads as follows:
# nIter   CFD_volFracScale    qf_total
  1       0.55                0.412096
  2       0.85                0.091448
  4       0.95                0.015188
 15       0.938889            0.003354
 21       0.935185            0.00059
The iteration returning the lowest value of the quality
function is the number 21, where the quality function
measures the discrepancy, in absolute value, between the
reference and the simulated volume fraction. The fact that
CFD_volFracScale < 1 implies that particles are slighly
porous, which means that the DEM volume needs to be scaled
down by a factor smaller than one before being translated
into a voidfraction field for the CFD domain.
Ergun test result
The convergence of the calibration is reported in the file
calibration_CFD_scaleDrag/results/conv.dat, which reads as follows:
# nIter    CFD_scaleDrag    qf_total
  1         2.05            0.354244
  3         0.75            0.0832562
  9         0.605556        0.0269864
 16         0.621605        0.0235446
The iteration returning the lowest value of the quality function is the number 16. The comparison between the reference and the simulated scaled pressure drops can be seen in Figure 2.
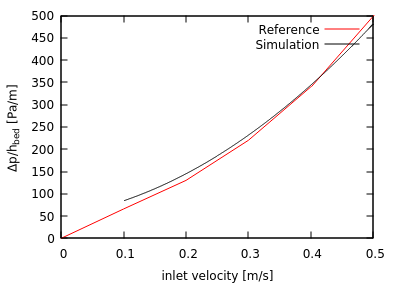
Figure 2: scaled pressure drop across the particle bed (reference and simulation 16).
In summary, the result of the calibration consists of the following parameter triplet:
rho_p = 853.086
CFD_volFracScale = 0.935185
CFD_scaleDrag = 0.621605
Calibration with multispheres
The used can substitute spherical particles with multispheres
(see Figure 3) by changing the ergun_test.casx input file
as follows:
particle_template p1 shape multisphere file ms.txt
#particle_template p1 shape sphere radius ${rp1}
particle_distribution p templates p1 mass_fractions ${mf1}
The shape of the multisphere is defined in the file ms.txt.
Each line corresponds to a particle forming the multisphere, while
the columns contain, in order, the x, y, z coordinates of the
particle center and its radius.
By rerunning the calibration, the following parameter triplet is obtained:
rho_p = 843.21
CFD_volFracScale = 0.935185
CFD_scaleDrag = 0.252469
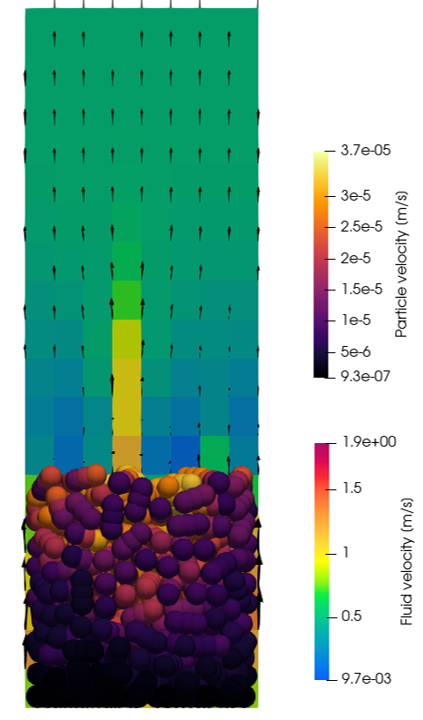
Figure 3: Ergun test using multispheres.