 Home
HomeBonded particles colliding with an obstacle
In this tutorial we insert 4 bonded particles that consist of 3 spheres each. Two of the particles are inserted with a specified orientation and a velocity of 1 m/s, the other two particles are inserted with random orientation and a velocity of 0.5 m/s. The particles are brought to collision with a cuboid obstacle. In addition to the particle-properties also the force network is written to the output files for a visualization in Paraview:
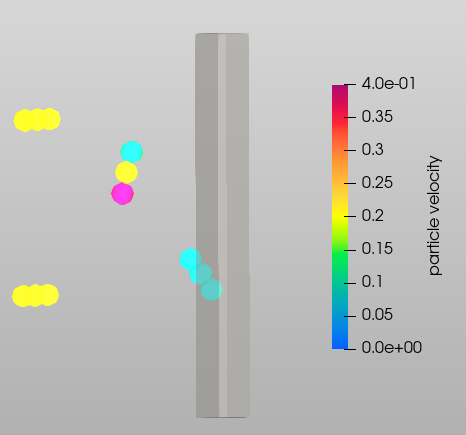
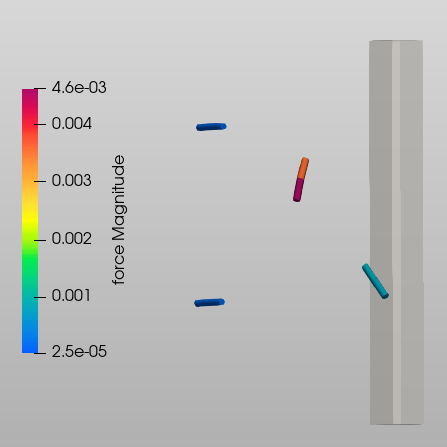
Name of the case: Project_Bonded_Particles
Setting up the simulation
As a first step, the particle shape, the used material and the simulation domain are defined in the General Settings tab. Please note that in case of multiple dependent simulations, the dimensions of the simulation domain can only be defined in the first simulation. This means that the box forming the simulation domain has to be chosen big enough from the beginning.
General settings
In this simulation we set particles of particle shape bonded:

A single materials command with the name material1 is used:

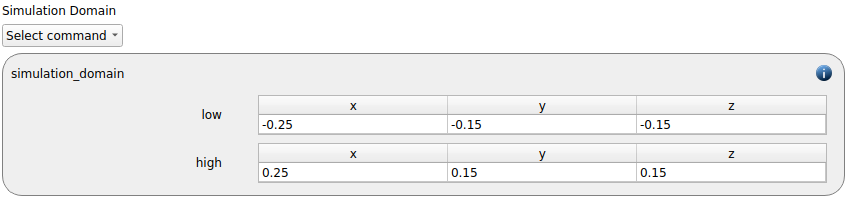
The simulation domain with x dimensions ranging from -0.25 to 0.25 and y and z dimensions ranging from -0.15 to 0.15 is created:
Meshes and regions
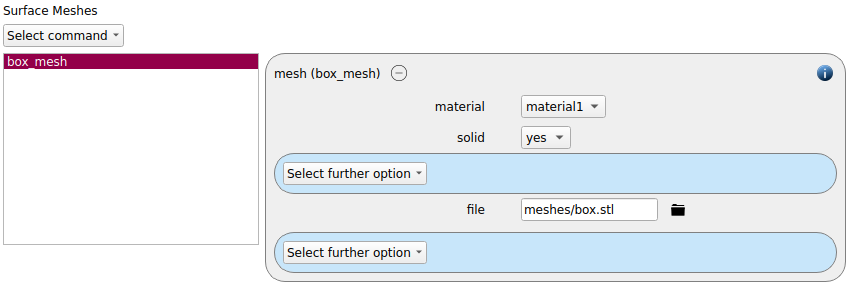
We use a box-shaped mesh for the obstacle, which we insert via the mesh command command:
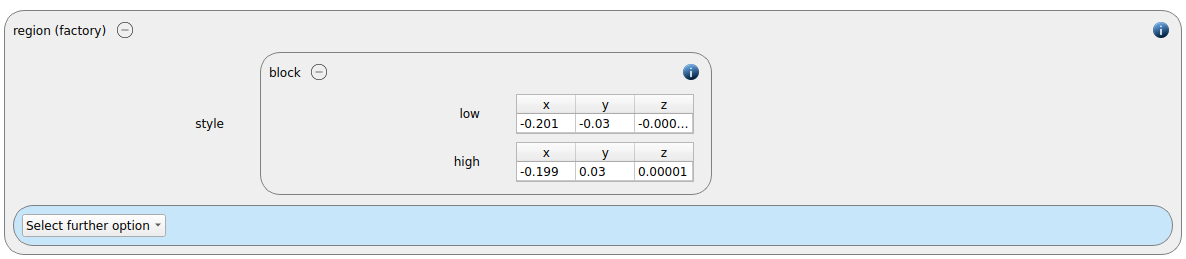
For particle insertion a block-shaped region is defined:
Physics models
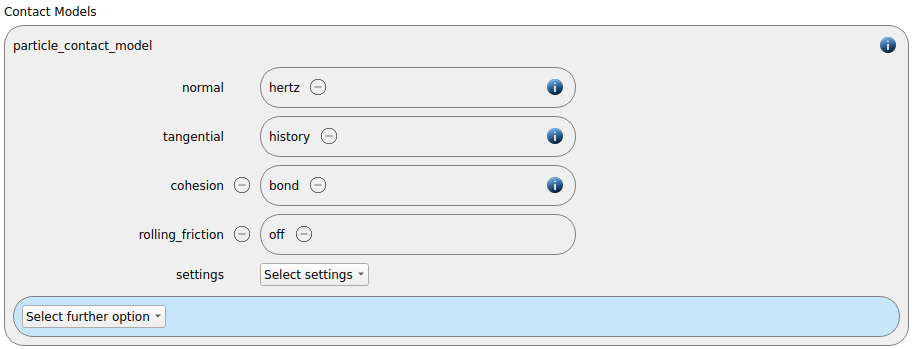
The contact models are now defined. For the particles we use the normal contact model hertz, the tangential model history and the cohesion model bond:
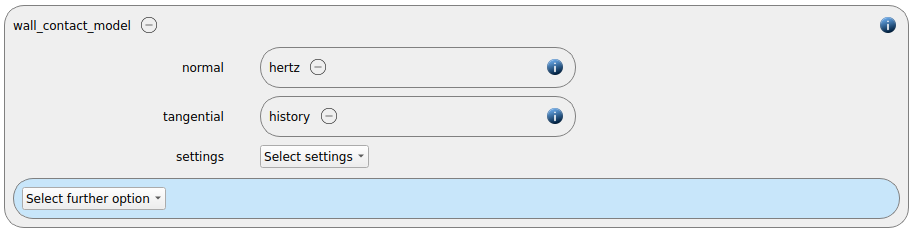
Since we added a mesh in the previous section, a wall contact model is also added automatically to this section. We use the normal contact model hertz and the tangential model history:
The default gravity command is removed from the simulation setup.
Particles
In the general settings tab we only defined a single material type (default), whose settings have to be specified here:
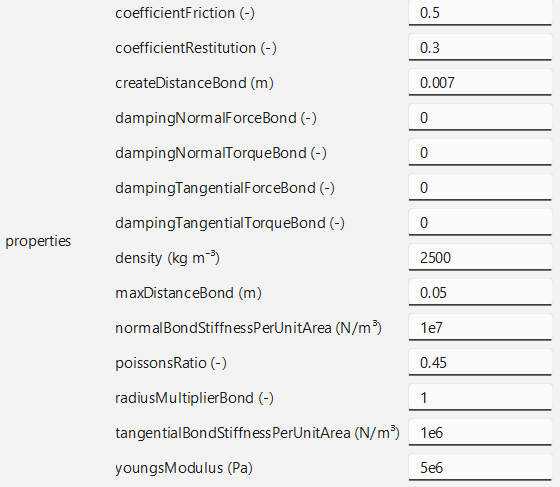
Please note that the list of properties contains more entries than acutally required for the bond model in the used configuration. Other configurations that can be defined via adding keywords in the settings section require more input. Please set the values for the unnecessary parameters to zero (they will simply be ignored). Please have a look at the bond model documentation for more information.
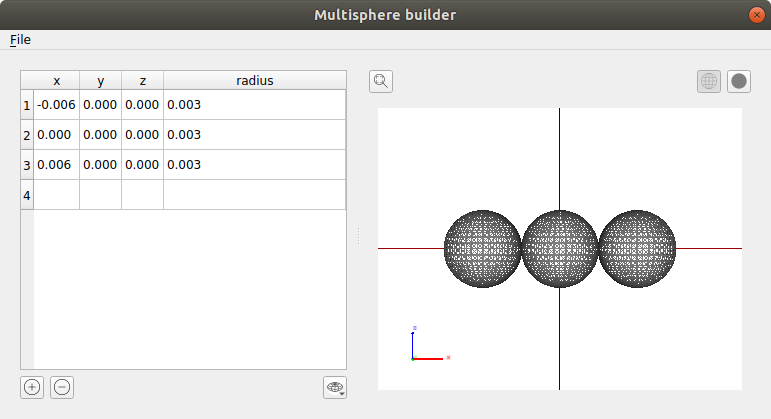
Before generating a new particle template, we generate the particle with the aid of the multisphere builder (Tools/MS Builder):
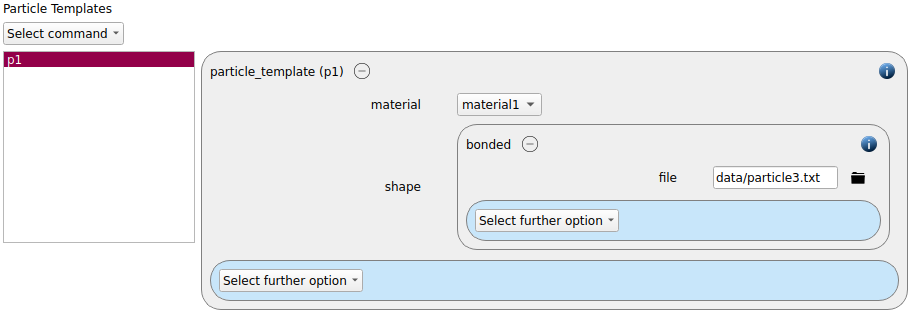
The generated particle file is used for a particle template of style bonded:
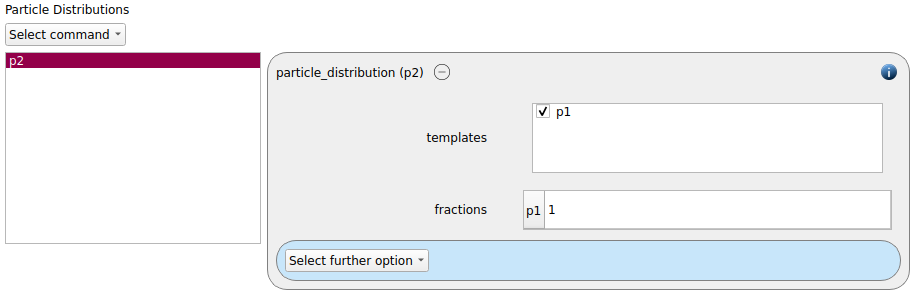
In the next step the particle distribution is generated:
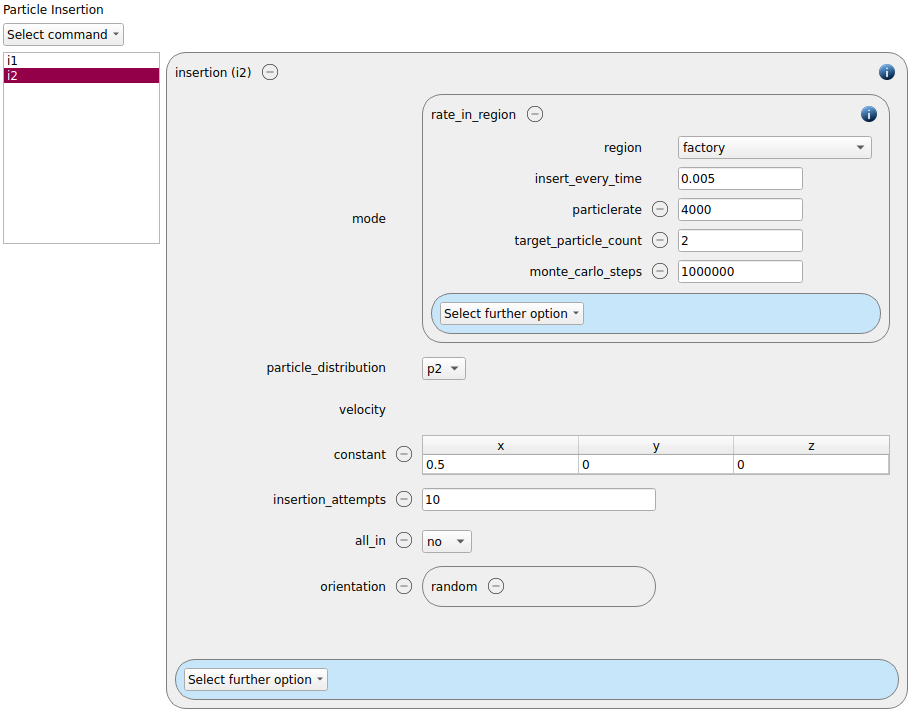
Now two insertion commands are added. In both cases an insertion command of type rate_in_region is used. The properties for the two commands are listed in this table:
insertion 1 |
insertion 2 |
|
mode |
rate_in_region |
rate_in_region |
region |
factory |
factory |
insertion_every_time |
0.005 |
0.005 |
particlerate |
4000 |
4000 |
target_particle_count |
2 |
2 |
monte_carlo_steps |
1000000 |
1000000 |
particle_distribution |
p2 |
p2 |
velocity |
constant (1,0,0) |
constant (0.5,0,0) |
insertion_attempts |
10 |
10 |
start_time |
0.00005 |
— |
all_in |
no |
no |
orientation |
constant (0.70711, 0, 0.70711, 0) |
random |
These screenshots show the orientation entry for the first insertion command as well as the entire second insertion command:

Simulation control
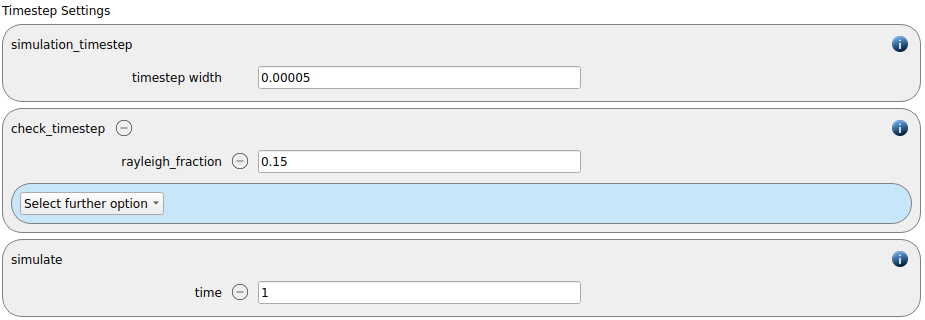
In this tab, we first define the time-step settings such as the desired simulation timestep of 0.00005 seconds and the total simulation time of 1 second. Per default also the check_timestep command command is enabled, which throws a warning when the time step exceeds 10 % of the Rayleigh or the Hertz time. These thresholds can be changed by setting an alternative value for hertz_fraction or rayleigh_fraction.
Output settings
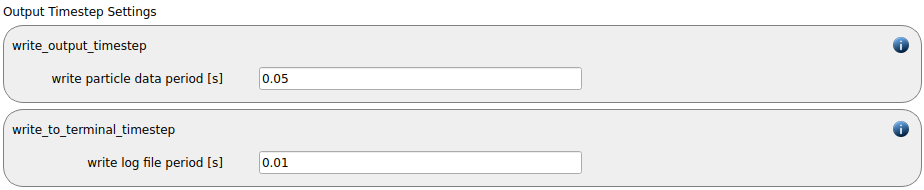
In this tab we first define the timestep width for the file and the terminal output:
The output_settings command command the takes care that all particle information and the meshes are written to files accordingly. The option write_particle_contact_network is set to yes, so also the particle-particle contacts plus the according forces can be visualuized:

Running the simulation
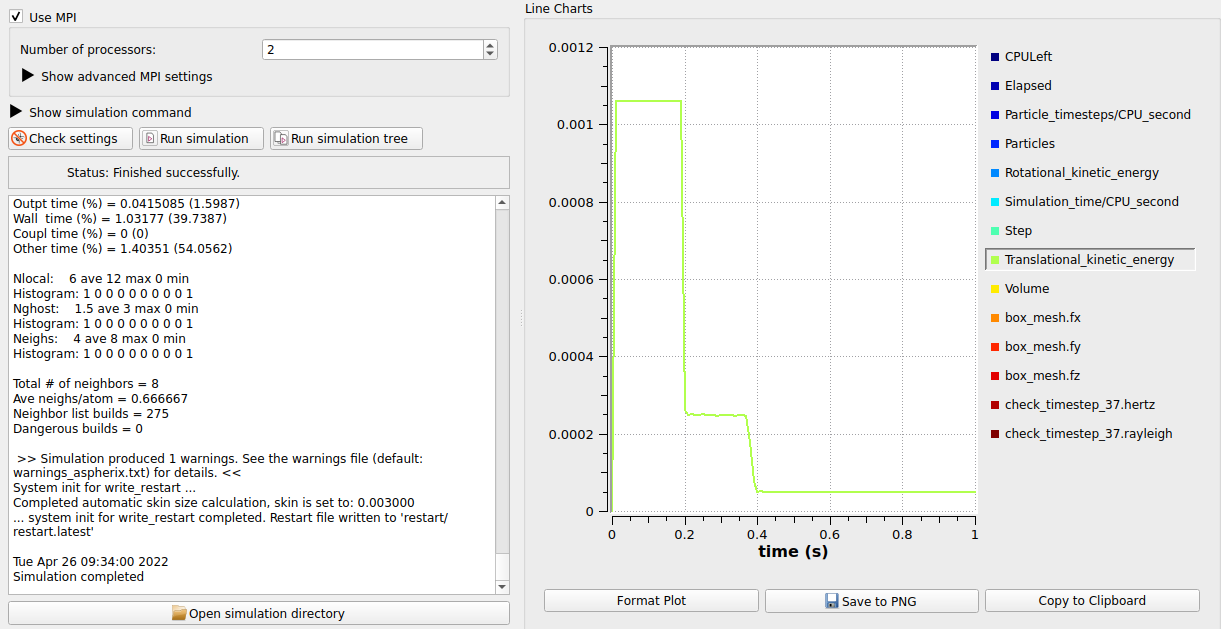
After completing the setup and saving it, the simulation can be launched. Hence, change to the Simulation view. First hit the “Check settings” button, and if the check returns “Check settings successfully completed” the simulation can be run by hitting “Start”. As can be seen in the the kinetic energy graph below, simulation runs for 1 second (20000 time steps):
Postprocessing with Paraview
After the simulation is completed, all data written with the output_settings command can be visualized automatically by going to the Visualization view and hitting the “Start Paraview” button.
The images below show the final state of the simulation briefly after the impact of the second group of particles. The first image shows the particles colored according to their velocity, the second image shows the force network between the particles.