 Home
HomeRunning a Simulation
Simulation Tab
Once the simulation setup is completed, the calculations can be launched here. For CPU-based cases, you can specify whether a simulation should be run in serial or parallel (the latter is recommended for most cases), and also specify the number of processors that will be used.
As soon as the simulation is started, the graphical window shows global simulation information such as the number or particles the translational and rotational kinetic energy, the output from the check_timestep command or other global quantities that are calculated during the simulation (e.g., center of mass, wear, forces on meshes, …).
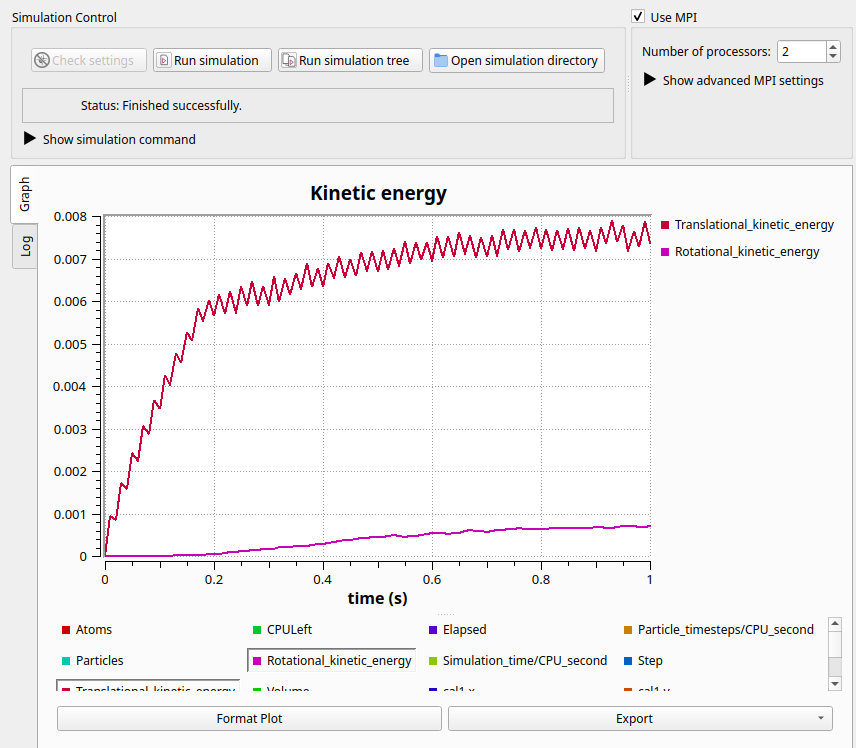
Show simulation command button: displays the simulation command being executed.
Format Plot button: lets you add a title, axis labels, or a footer, adjust the plot range, and switch the axes between linear and logarithmic scales.
Export button: saves the plot as a PNG or copy it to the clipboard. Also, theplot data or the entire (global) simulation data to a CSV file or an Excel-compatible CSV file.
The simulation’s log output window can be accessed by toggling from the graph window.
Simulation Status
After launching a simulation for the first time, it is marked with one of the following status symbols:
Completed |
Outdated |
Invalid |
Running |
Queued |
|
|
|
|
|


Completed: This symbol indicates that the simulation ran successfully and that the results are up to date.
Outdated: This symbol indicates that the simulation ran and that there are results, which are outdated. They can still be visualized but not used as basis for a derived simulation.
Invalid: This symbol indicates that the simulation has been started but that there are no valid simulation results. This happens for example when a simulation is aborted.
Running: This symbol indicates that the simulation is currently running.
Queued: This symbol indicates that the simulation has been added to the job queue and will be launched as soon as the required data has been generated and a sufficient number of processors is available.
Job Queue
In Aspherix® GUI tree-structures are used to organize simulations within projects. Results of simulations can be used as starting point for one or more derived simulations, the number of derived simulations is not restricted. A derived simulation can only be started if the parent simulation was run successfully. For a more efficient run of consecutive simulations the job queue was implemented. This functionality allows for both a top-down and a bottom-up mode. Depending on the position of the current simulation either of the modes (or a combination of them) comes to application when selecting “Run simulation tree”.
The following example shows the functionality:
Assume we have a project with the following structure:
Simulation1
⤷ Simulation2
⤷ Simulation3
    ⤷ Simulation4
    ⤷ Simulation5
Simulation6
Simulation1 and Simulation6 are both level-one simulations, they are independent from each other and any other simulation. Simulation2 and Simulation3 are both derived from Simulation1, Simulation4 and Simulation5 are derived from Simulation3. Simulation2 and Simulation4 are thus independent from each other, Simulation4 and Simulation5 are independent from each other as well.
Scenario 1: “Run simulation tree” is selected for Simulation1. This will add Simulation1, Simulation2, Simulation3, Simulation4 and Simulation5 to the job queue. Simulation6 is ignored.
Scenario 2: “Run simulation tree” is selected for Simulation6. This will add Simulation6 to the job queue. All other simulations are ignored.
Scenario 3: “Run simulation tree” is selected for Simulation3. If Simulation1 has any other simulation_status than “completed” it is added to the queue. Furthermore, also Simulation3, Simulation5 and Simultion5 are added.
Scenario 4: “Run simulation tree” is selected for Simulation3. If Simulation1 or Simulation3 have any other simulation_status than “completed” they are added to the queue. Furthermore Simulation5 is added to the queue as well. All other simulations are ignored.
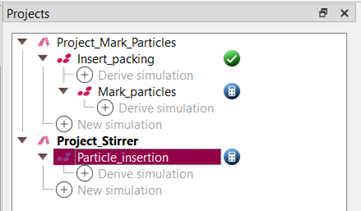
More than one simulations can run at once if the order permits it. The amount of active simulations can at most be equal to the number of threads.
The below image shows an example for an avtively used job queue: one simulation has already been completed while two others are currently executed.
Stop / resume functionality
Running simulations can be stopped and continued at a later time. When clicking the “Abort simulation” button the following window opens:
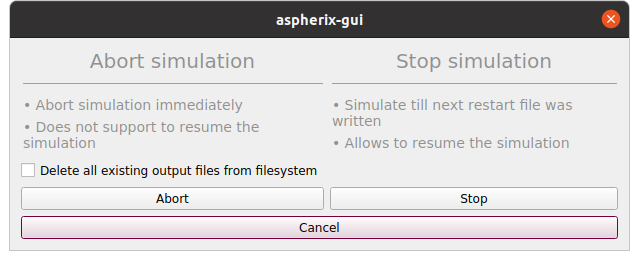
When selecting the “Abort” option, the simulation is aborted immediately, and a restart is not possible. When clicking “Stop”, the writing of a restart file is triggered automatically, the simulation still goes on until the restart file is written and then the simulation is stopped automatically. Depending on the case it can take up to a couple of minutes until “stopping” is completed. When this option was selected, the simulation can be resumed at a later state.
Once the simulation has been stopped, the status of the simulation is “Incomplete simulation”:
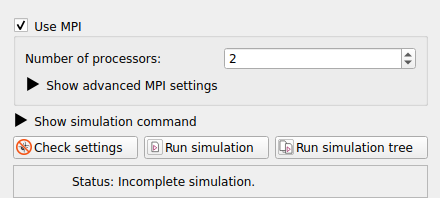
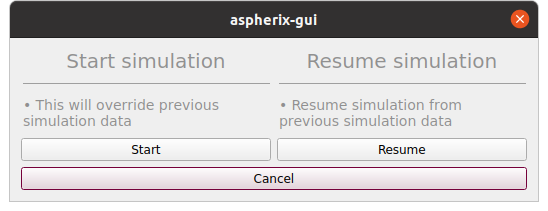
To resume the simulation, please use the “Run simulation” button. You are then offered the possibility to either start the simulation from the beginning (all old data will be overwritten) or to resume (starting from where the simulation was stopped):
The global data displayed in the graph starts from the stopping point, but when visualizing the data in Paraview or Ovito, the entire simulation data from the beginning is shown.
Warning
Please note that the simulation can only be resumed if the simulation setup is not modified after stopping the simulation.
Postprocessing
Visualization Tab
This tab enables visualization of simulation results using Paraview or Ovito, provided the paths are correctly set (see options_). An automatic post-processing routine is applied to the output data of the active case. Note that the visualization button is only enabled when output data is available for the selected simulation.
For Paraview, several options are available, such as specifying the total number of views when opening Paraview and choosing whether to use the system Paraview settings or those from the provided load script.
The Visualize entire simulation tree option allows you to visualize the results of all simulations in the tree. Please note that this is currently a static feature, meaning the reload files functionality cannot yet be applied.
Post-simulation evaluations
Since Aspherix® 6.3.0 is is possible to extract additional post processing data based on results of completed simulations. A detailed description of the functionality as well as some examples can be found here.