 Home
HomePrismatic fluidized bed
This section shows a validation of the CFDEM®coupling solver cfdemSolverPiso using the experimental measurements of a fluidized bed. The drag model employed for the CFDEM®coupling simulation is Koch Hill. The simulation setup is shown in Figure 1 while information about the experimental setup can be found in the publication from Mueller et al.. The results from CFDEM®coupling are also compared with the ones from another CFD-DEM simulation using the Wen and Yu drag law. These numerical results can also be found in the publication from Mueller et al..
Note
This case is located in CFDEMcoupling/validationCases/fluidizedBed_Mueller2009.
The quantity used for comparing the experimental and simulation results is the time-averaged voidfraction.
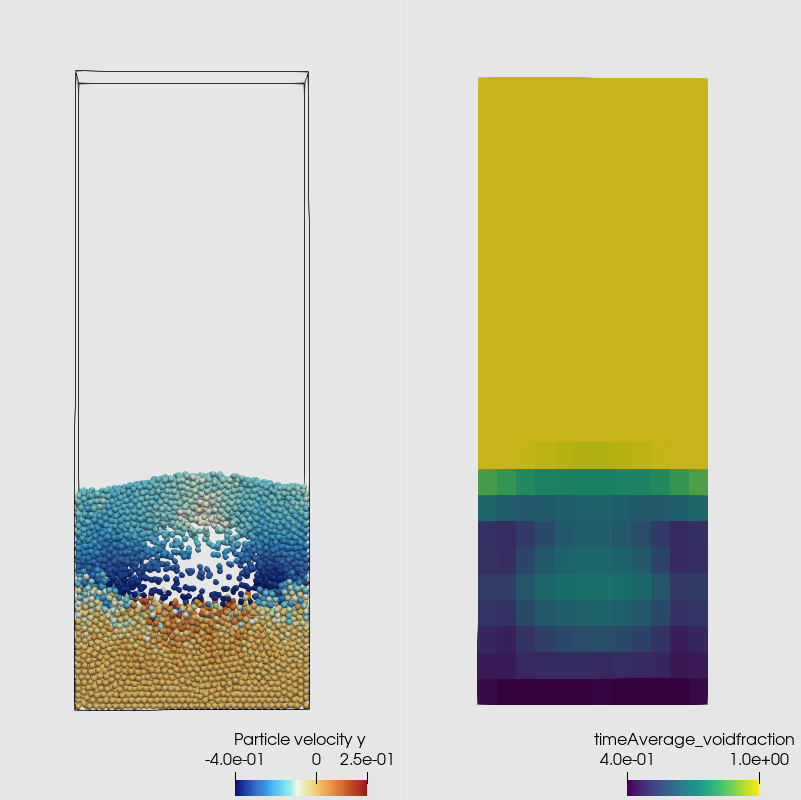
Figure 1: simulation result showing (left) particles colored with their velocity and (right) the time-averaged voidfraction field. The video of the simulation can be found here.
The average voidfraction at y=0.0164 m obtained by CFDEM®coupling matches both the experimental measure and the alternative simulation result, see Figure 2. As the distance from the bottom wall increases, the difference between experimental and numerical results slightly increases, as shown in Figure 3 for y=0.0312 m. Here it is worth highlighting that such a deviation affects both simulations, independently from the drag model.
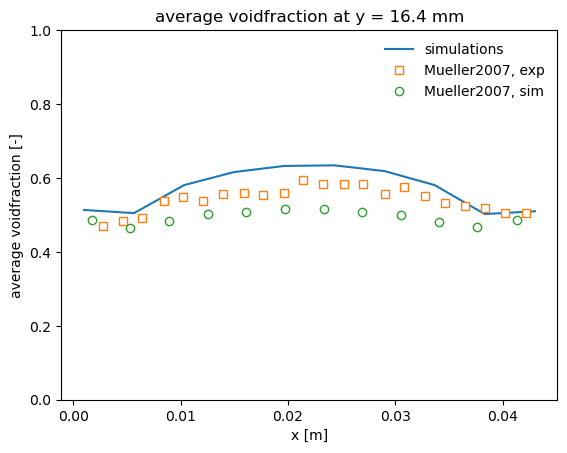
Figure 2: Comparison of simulated and experimental time-averaged voidfraction at y = 16.4 mm.
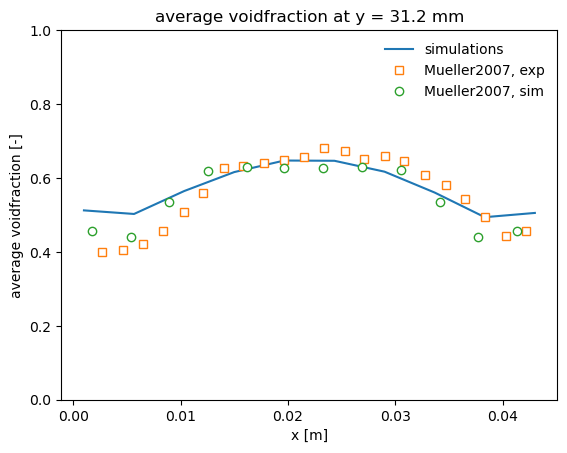
Figure 3: Comparison of simulated and experimental time-averaged voidfraction at y = 31.2 mm.
Literature
[1] Mueller, Christoph R., et al. Validation of a discrete element model using magnetic resonance measurements. Particuology 7.4 (2009): 297-306.
[2] Wen, C. Y. and Yu, Y. H. Mechanics of fluidization. Chemical Engineering Progress Symposium Series (1966): 62, 100-111